Pascal's Triangle Wall Chart
9781775701316
Vendor: SmartLabs
Couldn't load pickup availability
- Fast Nationwide Delivery
- 100% Quality Guaranteed
- Reliable & Secure Payments
Have a question about this product?
Send us a message and we'll get back to you.
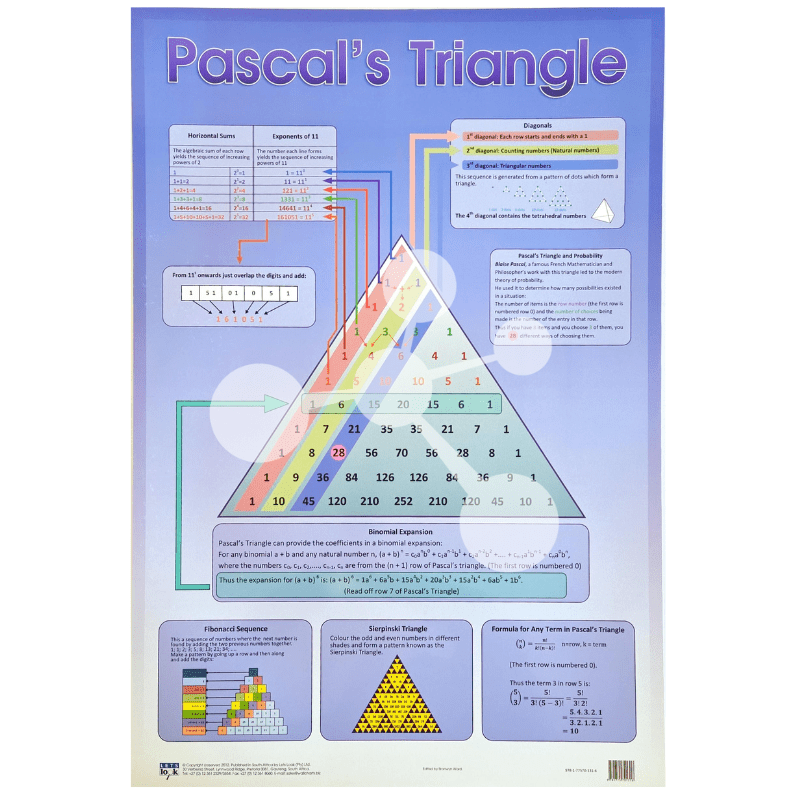
The Pascal's Triangle Wall Chart is a comprehensive mathematics learning resource designed to help students understand one of the most important numerical patterns in mathematics. Using a large, colour-coded triangular diagram and detailed explanatory sections, this educational wall chart makes complex mathematical concepts easier to visualize and remember. Ideal for classrooms, tutoring centres, and home study environments, this poster supports learners studying number patterns, algebra, probability, and combinatorics.
The centrepiece of the wall chart is a clearly illustrated Pascal's Triangle, with each row displaying the correct sequence of numbers generated by adding adjacent values from the previous row. Colour-coded arrows highlight the different diagonals and demonstrate the unique mathematical sequences they create. Students learn that the first diagonal contains only ones, the second diagonal represents the natural counting numbers, the third diagonal forms the triangular numbers, while the fourth diagonal introduces tetrahedral numbers. These visual explanations help learners recognise important numerical relationships within the triangle.
Additional educational sections explain how Pascal's Triangle relates to the powers of 2 through horizontal row sums and demonstrates how the rows correspond to increasing powers of 11. A worked example shows how larger powers of 11 can be calculated by overlapping digits and carrying values, making advanced number patterns easier to understand.
The chart also introduces the practical application of Pascal's Triangle in probability and combinations. Students learn how each value represents the number of possible selections in combinatorial problems, with simple explanations linking row numbers and combinations. A dedicated section explains the binomial expansion, showing how the coefficients of algebraic expressions can be read directly from Pascal's Triangle, complete with a fully worked expansion example.
Further enrichment is provided through sections exploring the Fibonacci Sequence, demonstrating how Fibonacci numbers are formed by adding diagonal values within the triangle. The chart also introduces the fascinating Sierpinski Triangle, illustrating how colouring odd and even numbers reveals a famous fractal pattern. Finally, learners are shown the mathematical formula used to calculate any individual term in Pascal's Triangle using combinations and factorial notation.
With colourful diagrams, step-by-step examples, mathematical formulas, and clearly organised layouts, this wall chart serves as both a quick classroom reference and an engaging learning poster that strengthens understanding of algebra, number theory, probability, and mathematical patterns across multiple grade levels.