Trigonometric Graphs 3 Wall Chart
9781920059187
Vendor: SmartLabs
Couldn't load pickup availability
- Fast Nationwide Delivery
- 100% Quality Guaranteed
- Reliable & Secure Payments
Have a question about this product?
Send us a message and we'll get back to you.
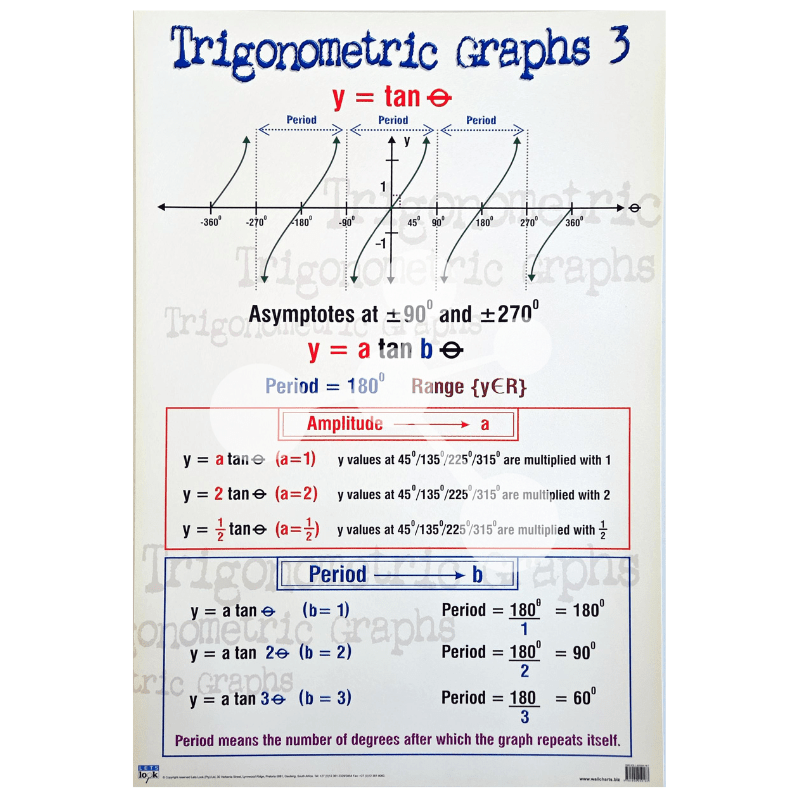
The Trigonometric Graphs 3 Wall Chart is a comprehensive educational resource designed to help learners understand the properties and transformations of the tangent function. This visually engaging wall chart presents the graph of y = tan θ, making it easier for students to identify key characteristics such as asymptotes, periods, and the repeating nature of the tangent graph. Ideal for classrooms, mathematics laboratories, tutoring centres, and home study environments, this educational poster provides a clear reference for trigonometry concepts taught in secondary school and beyond.
The chart begins by illustrating the standard tangent graph (y = tan θ) across multiple cycles, showing the repeating pattern between −360° and 360°. It clearly marks the vertical asymptotes at ±90° and ±270°, while highlighting the graph's period and the points where the function crosses the origin. These labelled diagrams help students visualise how the tangent function behaves over different intervals.
A dedicated section explains the general equation y = a tan bθ, breaking down how the constants a and b affect the graph. The amplitude (vertical scaling factor) is demonstrated through examples including y = tan θ, y = 2 tan θ, and y = ½ tan θ, showing how the y-values change while maintaining the graph's overall shape. Another section explains how the value of b changes the graph's period, using worked examples for b = 1, b = 2, and b = 3, alongside the formula Period = 180° ÷ b.
The wall chart also reinforces key mathematical concepts by defining the range of the tangent function, explaining the meaning of a period, and using colour-coded diagrams to distinguish between graph transformations. This educational poster is an excellent visual aid for revision, exam preparation, and classroom instruction, enabling learners to quickly understand tangent graphs, graph transformations, asymptotes, periodic functions, and trigonometric equations through easy-to-follow illustrations and mathematical examples.